Ablation Studies
To rigorously validate the architectural choices within DantinoX, we conducted extensive hyperparameter sweeps using Weights & Biases (W&B). Instead of relying on conventional wisdom, every major component—from routing penalties to attention mechanics—was empirically tested against hardware constraints and convergence stability.
The insights below are derived from analyzing the joint distribution of validation loss (val_loss), peak memory footprint (vram_gb), and execution speed (ms_per_step) across hundreds of Bayesian trials.
1. Model Capacity & Convergence Dynamics
This section analyzes how fundamental model scaling laws (depth vs. width) and core training hyperparameters impact the final language modeling performance.
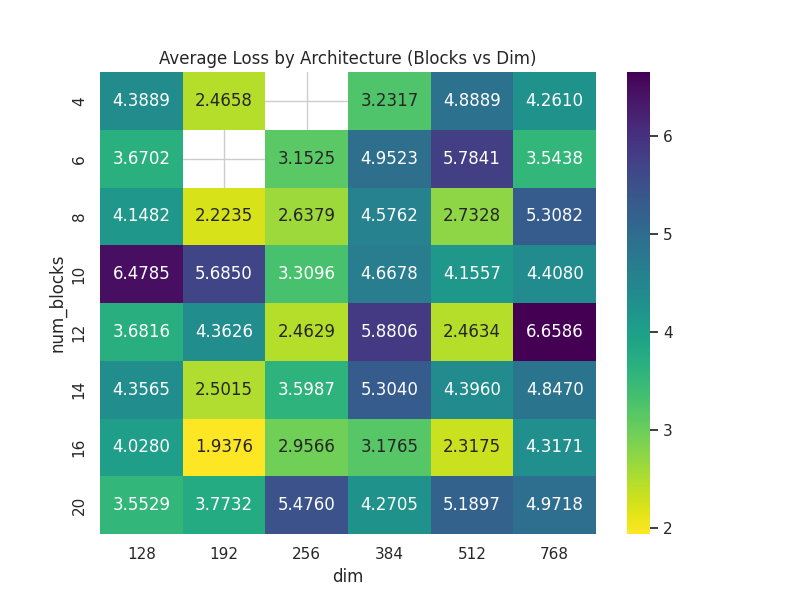
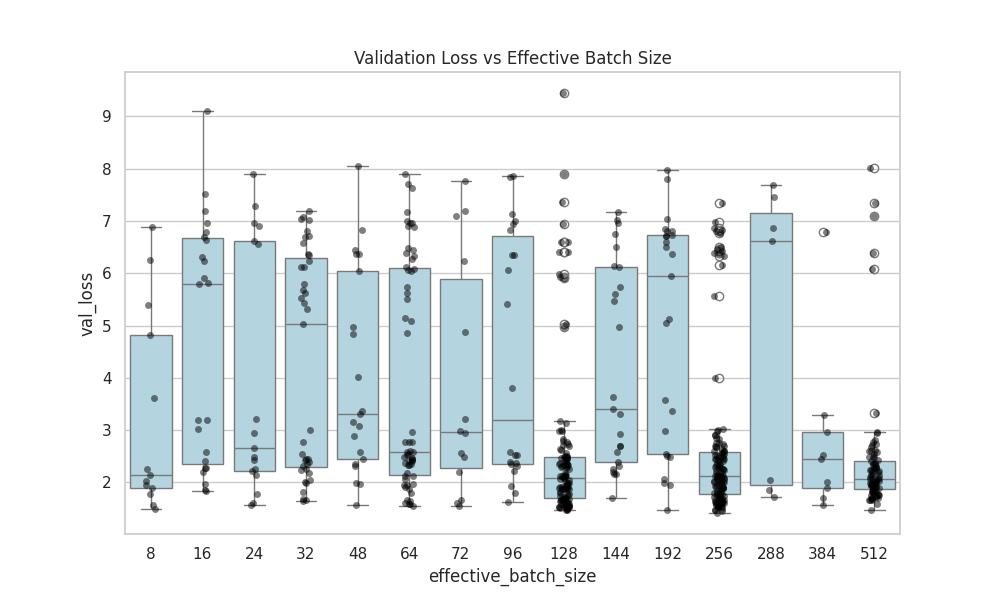
Depth, Width, and Batch Scaling
Average Loss Heatmap |
Effective Batch Size |
|---|---|
|
|
Average Loss by Architecture: A contour map illustrating the sweet spot between model depth ( |
Validation Loss vs Batch Size: Boxplot distribution demonstrating the variance and stabilization of the validation loss as the global effective batch size increases. |
Optimizer & Learning Rate Sensitivity
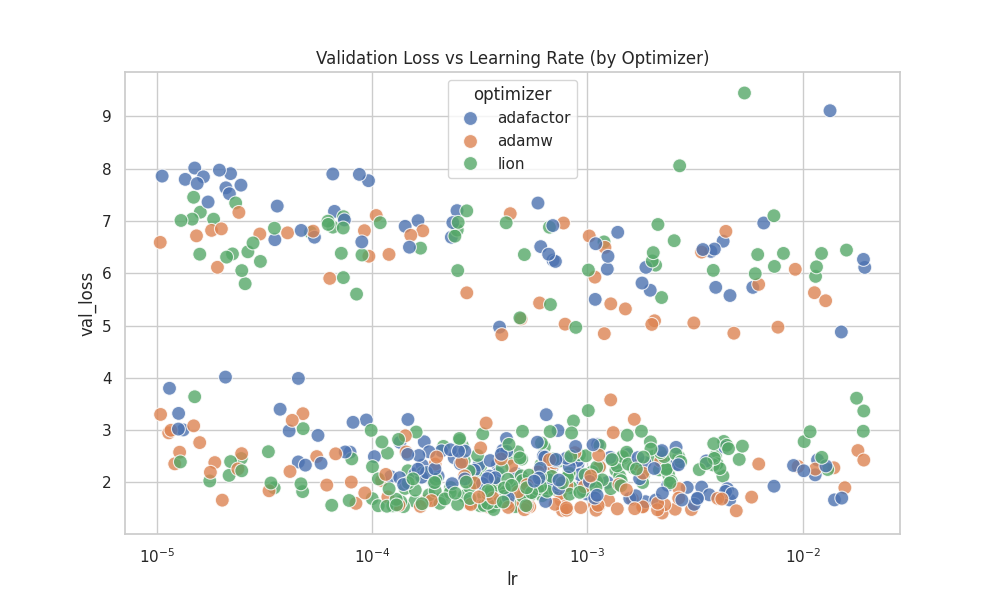
Learning Rate vs Optimizer |
|---|
|
Optimizer Convergence Basins: A logarithmic analysis comparing AdamW, Adafactor, and Lion across different learning rates, identifying the most stable convergence basin for each. |
2. Architecture Specifics & Memory Efficiency
Modern LLM engineering is primarily memory-bound. This section proves the efficiency of the advanced architectural features implemented in DantinoX to reduce the GPU footprint.
Parameter Sharing & Attention Optimizations
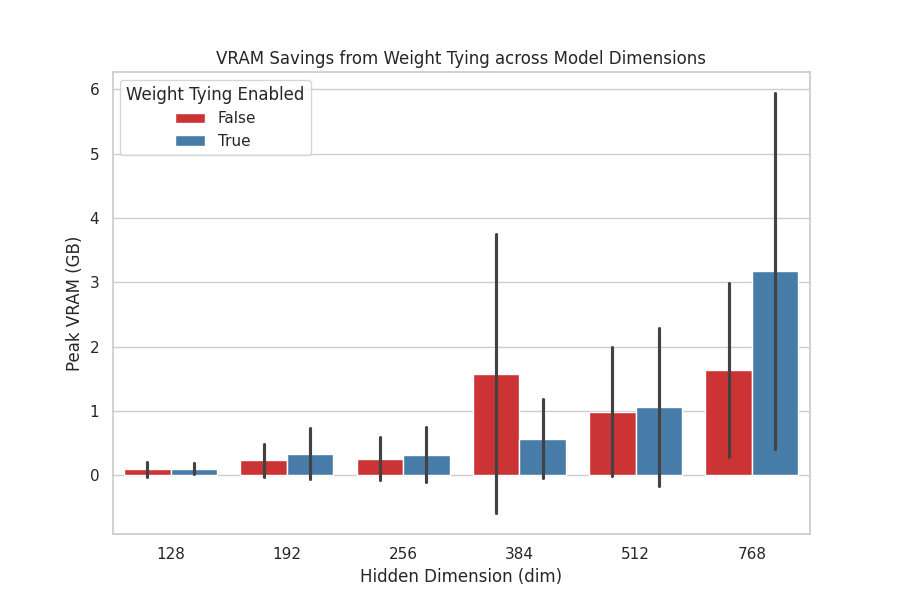
Weight Tying VRAM Savings |
|---|
|
Weight Tying: Empirical verification of VRAM reduction achieved by sharing the embedding matrix with the output LM head across different model dimensions. |
VRAM Scaling Laws
Context Length Memory Cost |
Model Capacity VRAM Heatmap |
|---|---|
|
|
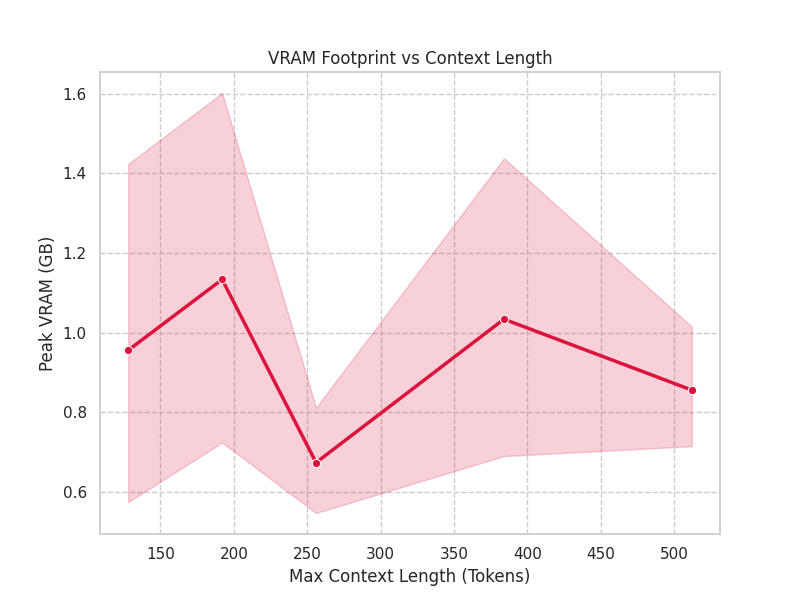
Context Window: Proves the linear/quadratic VRAM cost associated with expanding the sequence length, highlighting the critical need for optimizations like Sliding Window attention. |
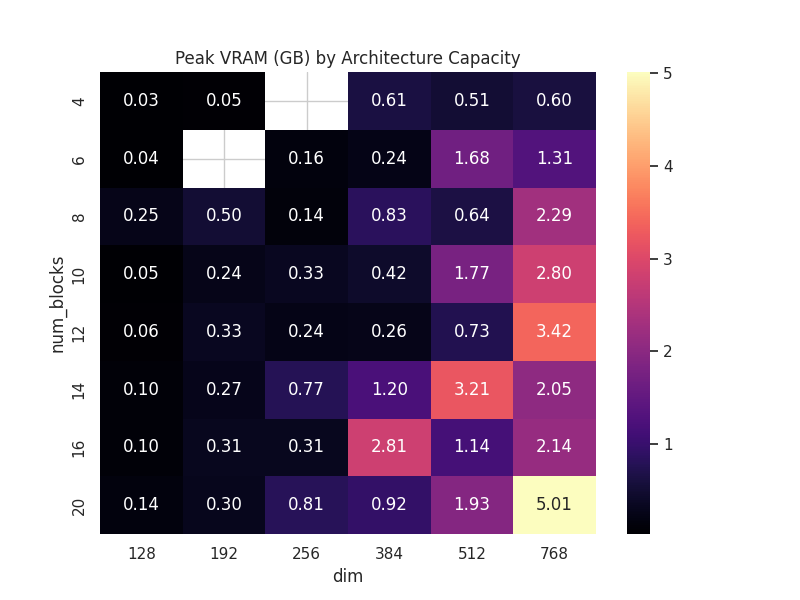
VRAM Lookup Heatmap: A visual reference guide mapping hidden dimension ( |
3. Sparse Mixture of Experts (MoE) Analysis
Implementing MoE in JAX requires careful balancing of speed overhead and routing quality. This section provides a deep dive into the performance trade-offs of the gated MLP blocks.
Dense vs MoE Step Time |
Balancing Penalty Trade-off |
|---|---|
|
|
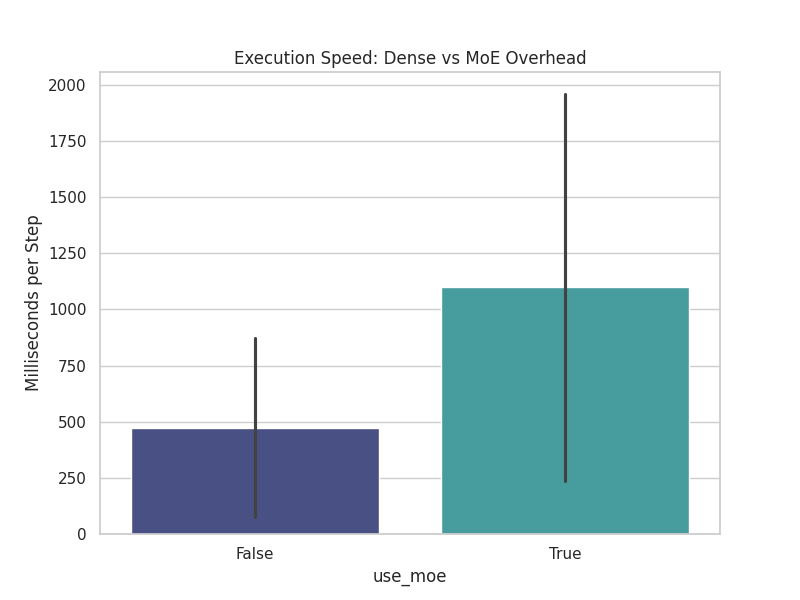
Routing Overhead: Direct comparison of milliseconds-per-step between Dense and MoE models, quantifying the actual XLA compilation and execution cost of token routing. |
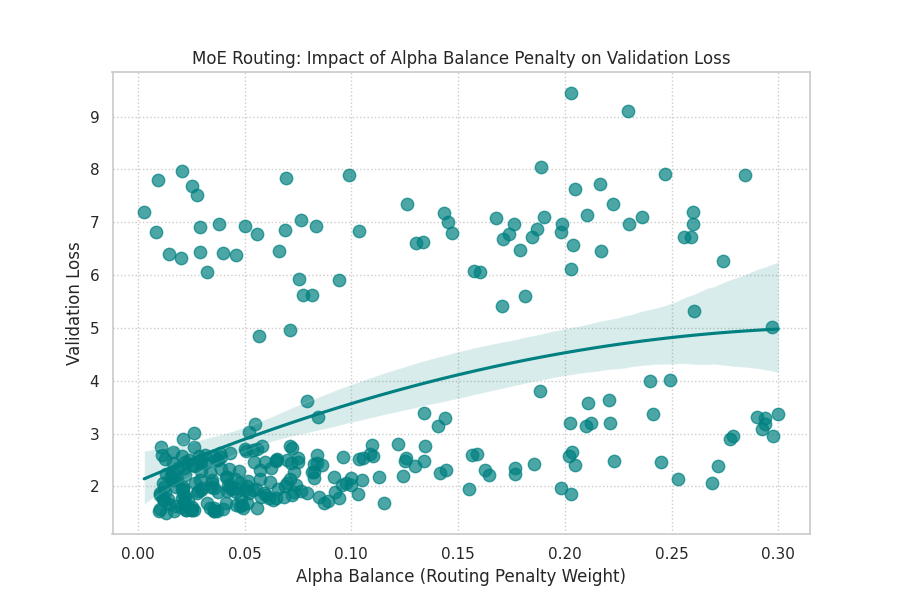
Expert Load Balancing: Regression plot illustrating the tension between routing fairness (Alpha Balance penalty) and cross-entropy loss. High penalties force expert usage but may degrade final language modeling accuracy. |
4. Regularization & Training Efficiency
The final section evaluates how to control overfitting and maximize the utilization of hardware resources during the training loop.
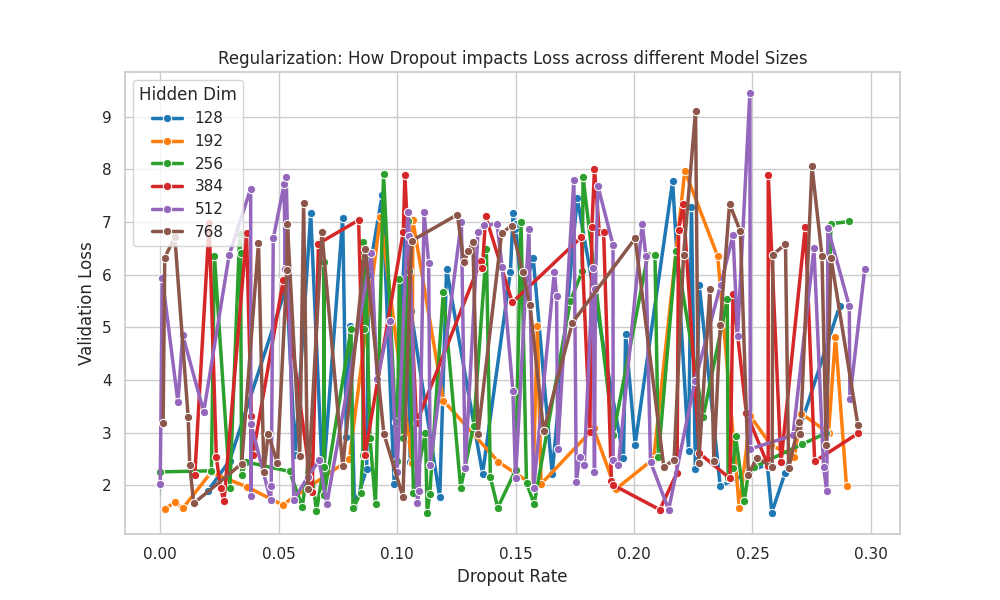
Dropout Effectiveness by Model Size |
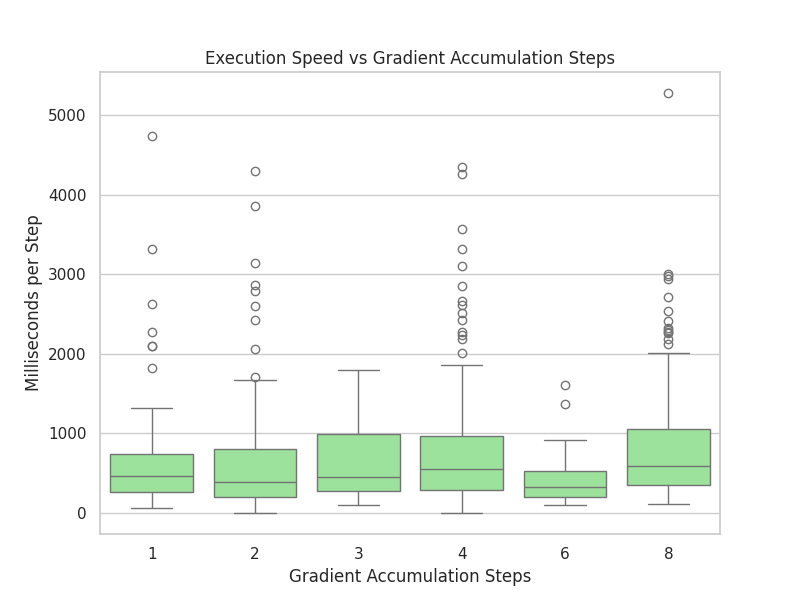
Gradient Accumulation Overhead |
|---|---|
|
|
Dropout Regularization: Analyzes the interaction between dropout rate and model capacity. It proves the rule of thumb that smaller models degrade with high dropout, while larger models require it to prevent overfitting. |
Execution Speed: Boxplot distribution showing how execution time scales with gradient accumulation steps. While accumulation saves VRAM, it introduces a subtle time penalty per virtual step. |
Appendix: Complete Parameter Distributions
For full transparency and reproducibility, the following expandable section contains the isolated distributions of every hyperparameter swept during the Bayesian optimization process, plotted against the target validation loss.
Click to expand all Base Distributions (Boxplots & Scatter Plots)
Categorical Architectural Choices (Boxplots)
These plots demonstrate the variance and median validation loss across boolean toggles and categorical selections.
Core & Routing |
Attention & Positional |
|---|---|
|
|
|
|
|
|
|
|


Numeric Hyperparameters (Scatter Plots)
These plots isolate continuous and discrete numerical values, complete with Spearman correlation trends.
Training Dynamics |
Memory & Context |
|---|---|
|
|
|
|
|
|
|
|


Architecture Dimensions |
Mixture of Experts (MoE) |
|---|---|
|
|
|
|
|
|
|


